
09 September 2014
Tutorial: Working with curved paths
Since the previous tutorial on moving objects along a path, we’ve received many requests for a tutorial that deals with curved paths, either generated via a bezier curve algorithm or “drawn” by the user’s touch on the screen. Today’s tutorial will cover both methods, including sample projects for download. In addition, we’ll walk through a basic module that makes an object follow the curved path.
Bezier method
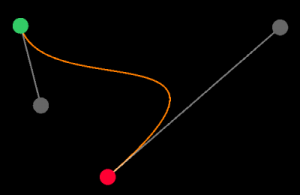
The first sample project, available for download, lets the user touch one point on the screen to set the starting point of the curve, then the user may drag outward to create a “handle” that will adjust the curve. Next, the user may touch a second point to indicate the ending point of the curve and likewise drag outward to adjust the handle. For anybody who has worked with paths in an image/vector editing program like Photoshop or Illustrator, this process will be very familiar.
Dissecting the entire sample project is beyond the scope of this tutorial, but a few elements near the top of the code are important to understand:
|
1 |
local curve |
This is simply an up-value reference to what will become, during manipulation of the anchors and handles, the display object (display.newLine()) for the generated curve. Instead of creating a separate object for each segment in the curve, we’ll use the convenient append() function to add segments to a core line object.
|
1 |
local pathPoints = {} |
This table will contain an ordered series of sub-tables, each of which will contain the x and y position of a point along the curve. The structure of each sub-table is very simple, for example: { x=10, y=24 }. These points will also be passed to the follow.lua module that places an object at the starting point and transitions it from point to point — this will be discussed further down.
|
1 |
local curveSegments = 100 |
This variable is important to mention since it allows us to easily adjust the “smoothness” of the curve. More specifically, this value represents the total number of segments which will constitute the curve, and thus, higher values will yield a smoother curve. The default is 100 which should be sufficient for most scenarios.
|
1 |
local followParams = { segmentTime=50, constantRate=true, showPoints=true } |
This table is also passed to the follow.lua module and it allows us to adjust the behavior of the routine via the following key-value pairs:
segmentTime— The time of the transition between each point along the curve.constantRate— Because the distance between points will vary, this sets the rate of movement to be more constant by using the length of the first segment as a basis and then adjusting the transition time of subsequent segments accordingly.showPoints— Iftrue, this will place a dot along each point in the curve.
Drawing method
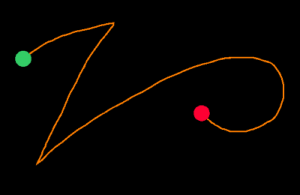 For generating a more “organic” path, we can use a path drawing module, also available for download. This method simply lets the user draw a path of any length by touching and dragging around the screen.
As above, dissecting the entire project is beyond the scope of this tutorial, but a few elements should be explained:
|
1 |
local path |
Similar to the bezier method, this is simply an up-value reference to what will become, as the user begins drawing, the display object for the path.
|
1 |
local pathPoints = {} |
This table serves the same purpose as in the bezier module. It will contain an ordered series of sub-tables, each of which will contain the x and y position of a point along the curve.
|
1 |
local pathPrecision = 20 |
This value represents the minimum distance between any two points along the path. This is especially important because, in the "moved" phase of a touch event, the user’s touch will be registered at very small increments and, if we created a path point on each increment, the pathPoints table would potentially be populated by hundreds or even thousands of coordinate sub-tables. That would result in an extremely “smooth” curve, but it’s more detail than necessary in most cases. Thus, the drawing routine will only register a new coordinate point if the distance from the previous point is greater than or equal to pathPrecision.
|
1 |
local followParams = { segmentTime=50, constantRate=true, showPoints=true } |
This table is serves the same purpose as in the bezier example, where segmentTime sets the transition time between points on the path, constantRate makes the movement speed more even, and showPoints plots the points along the path.
Object following the curve/path
For this tutorial, our follow.lua module uses basic transitions to move an object from point to point along the path. In addition, it uses a basic angleBetween() function to make the object face toward the next point as it moves along the path:
|
1 2 3 4 |
local function angleBetween( srcX, srcY, dstX, dstY ) local angle = ( math.deg( math.atan2( dstY-srcY, dstX-srcX ) )+90 ) return angle % 360 end |
init() function
The follow.lua module is initially set up via the init() function which is called from either of the demo projects outlined above. First, this function creates a polygon display object, places it at the x and y location of the path starting point (passed in as the startPoint argument), and sets its rotation to face the second point:
|
1 2 3 4 5 6 7 8 |
function M.init( params, pathPoints, pathPrecision, startPoint ) local follower = display.newPolygon( 0, 0, { 0,-28, 30,28, 0,20, -30,28 } ) follower:setFillColor( 1 ) follower.x = startPoint.x follower.y = startPoint.y follower.rotation = angleBetween( pathPoints[1].x, pathPoints[1].y, pathPoints[2].x, pathPoints[2].y ) |
A few lines after, we set a local variable precision with a default value equal to the pathPrecision argument. This is intended for compatibility between both the bezier example and the drawing example. In the bezier example, this argument can simply be passed in as a value of 0 because, in that module, there is no explicit set value for the distance between path points — instead, the algorithm creates the bezier based on a total number of segments. As a result, we must calculate a precision value based on the distance between the starting point and the second point, as indicated on line 75.
|
1 2 3 4 |
local precision = pathPrecision if ( pathPrecision == 0 ) then precision = distBetween( pathPoints[1].x, pathPoints[1].y, pathPoints[2].x, pathPoints[2].y ) end |
Next, we check if the showPoints parameter is true, we generate a dot along each point in the path by looping through the pathPoints table. Each point is added to a display group, pathPointsGroup, for easier cleanup when the curve is re-drawn.
|
1 2 3 4 5 6 7 8 9 10 |
if ( params.showPoints == true ) then local pathPointsGroup = display.newGroup() ; pathPointsGroup:toBack() for p = 1,#pathPoints do local dot = display.newCircle( pathPointsGroup, 0, 0, 8 ) dot:setFillColor( 1, 1, 1, 0.4 ) dot.x = pathPoints[p].x dot.y = pathPoints[p].y end M.ppg = pathPointsGroup end |
Finally, we call the follow() function and pass some core arguments to it:
|
1 |
follow( params, follower, pathPoints, precision ) |
Follow function
The follow() function essentially performs some calculations and begins a series of transitions where each subsequent transition is queued by the completion of the previous transition. The calculations include an adjustment of the transition time if the constantRate boolean is true.
|
1 2 3 4 5 6 |
local transTime = params.segmentTime --if "params.constantRate" is true, adjust time according to segment distance if ( params.constantRate == true ) then local dist = distBetween( obj.x, obj.y, pathPoints[obj.nextPoint].x, pathPoints[obj.nextPoint].y ) transTime = (dist/pathPrecision) * params.segmentTime end |
Additionally, we rotate the object to face the next point using the angleBetween() function:
|
1 2 3 4 |
--rotate object to face next point if ( obj.nextPoint < #pathPoints ) then obj.rotation = angleBetween( obj.x, obj.y, pathPoints[obj.nextPoint].x, pathPoints[obj.nextPoint].y ) end |
For the actual transition, we simply pass in some core parameters including the transTime calculated above and the x and y destination point. Additionally, we tag the transition with "moveObject" so it can easily be paused, resumed, or canceled, and we set the onComplete function to nextTransition so the process repeats until the object reaches the ending point. Finally, as each iteration occurs, we increment obj.nextPoint so the next transition moves to the next point along the path.
|
1 2 3 4 5 6 7 8 |
transition.to( obj, { tag = "moveObject", time = transTime, x = pathPoints[obj.nextPoint].x, y = pathPoints[obj.nextPoint].y, onComplete = nextTransition }) obj.nextPoint = obj.nextPoint+1 |
Pausing, resuming, canceling
Because we tag each transition in the sequence with "moveObject", pausing, resuming, or canceling is simple — just pass the tag name to one of the transition control APIs:
|
1 2 3 4 5 6 |
--pause the sequence transition.pause( "moveObject" ) --some time later, resume it transition.resume( "moveObject" ) --all finished... cancel it! transition.cancel( "moveObject" ) |
In summary
Hopefully this tutorial gets you started on curve-based path movement in Corona. Remember to download and carefully inspect the sample code used in this tutorial:
- CurveDrawing.zip — bezier module
- PathDrawing.zip — drawing module

Matt
Posted at 00:27h, 10 SeptemberAwesome tutorial! Thanks Brent!
Mo
Posted at 14:04h, 10 SeptemberFANTASTIC tutorial! Now enemies no longer need to follow a straight line 🙂
THANK YOU.
Mo
Jon
Posted at 22:20h, 10 SeptemberSo good. Thank you very much for this.
Fernker
Posted at 11:06h, 11 SeptemberIs there an easy way to convert this curved path into a physics curved path? I’m having troubles where the line (when added as a static physics body) turns into a rectangle.
Brent Sorrentino
Posted at 12:45h, 11 SeptemberHi @Fernker,
You can probably do so using a Box2D chain shape (edge shape) as shown in this guide:
http://docs.coronalabs.com/guide/physics/physicsBodies/index.html
Brent
edualc
Posted at 03:02h, 27 Februarythe pathDrawing works very well.
it’s just that .. one expect the path to disappear as the vehicle goes along its path. e.g. in flightPath.
i tried to add { alpha = 0.1 } to the transition_to but nothing happened.
How can we do that ?
before I used your code, i had an array of lines between coordinates so I could clear them one at a time. And that is not perfect because if the distance/time between 2 coordinate is very long, it will only clear it when reaching the second coord.
is there another way ?
thanks !
Edualc
Cliff
Posted at 20:57h, 03 MayHello,
I am trying to make a minimap for a racing game which has an object(will be a circle) run along it. I have a png and SVG file of a racetrack and have used the SVG files path element to create a set of straight lines roughly looks like the track and have successfully made a circle that follows the track. I now need to add curves but am unsure how to do so. a lot(if not all) the curves only use one control point in the SVG file. How would I make a curve based on that 1 control point?
Thanks you for your time,
Cliff.